| Course |
hilliness:
if Mt. SAC is a 10,
this is a: |
length |
total ascent
|
highest, lowest
difference |
average slope |
Mt. SAC
Walnut, CA
Gmaps Pedometer
3D image
profile
Google Earth
|
10 |
2.969mi*
|
540'
|
140'
|
6% |
Garin Park
Hayward, CA
Gmaps Pedometer
3D image
profile
Google Earth
|
8
|
3.157mi
|
447'
|
180'
|
5.4% |
Crystal Springs
Belmont, CA
Gmaps Pedometer
3D image
profile
Google Earth
|
|
2.955mi
|
460'
|
128'
|
6% |
Muller Vineyard
Yolo County, CA
Gmaps Pedometer
3D image
profile
Google Earth |
7
|
3.209mi |
357' |
69' |
4.6% |
Willow Hill
Folsom, CA
Gmaps Pedometer
3D image
profile
Google Earth
|
8
|
3.063mi
|
410' |
77.3'
|
12.4% |
William Jessup
Rocklin, CA
3D image
profile
Google Earth
|
7
|
3.13mi
|
380.1'
|
56.7'
|
11.6% |
Toro Park
Monterey County, CA
Gmaps Pedometer
3D image
profile
Google Earth
|
7
|
3.003mi |
359.1'
|
79.6'
|
13.7% |
Frogtown
Angels Camp, CA
Gmaps Pedometer
3D image
profile
Google Earth
|
6
|
3.043mi
|
350'
|
149.9'
|
20.5% |
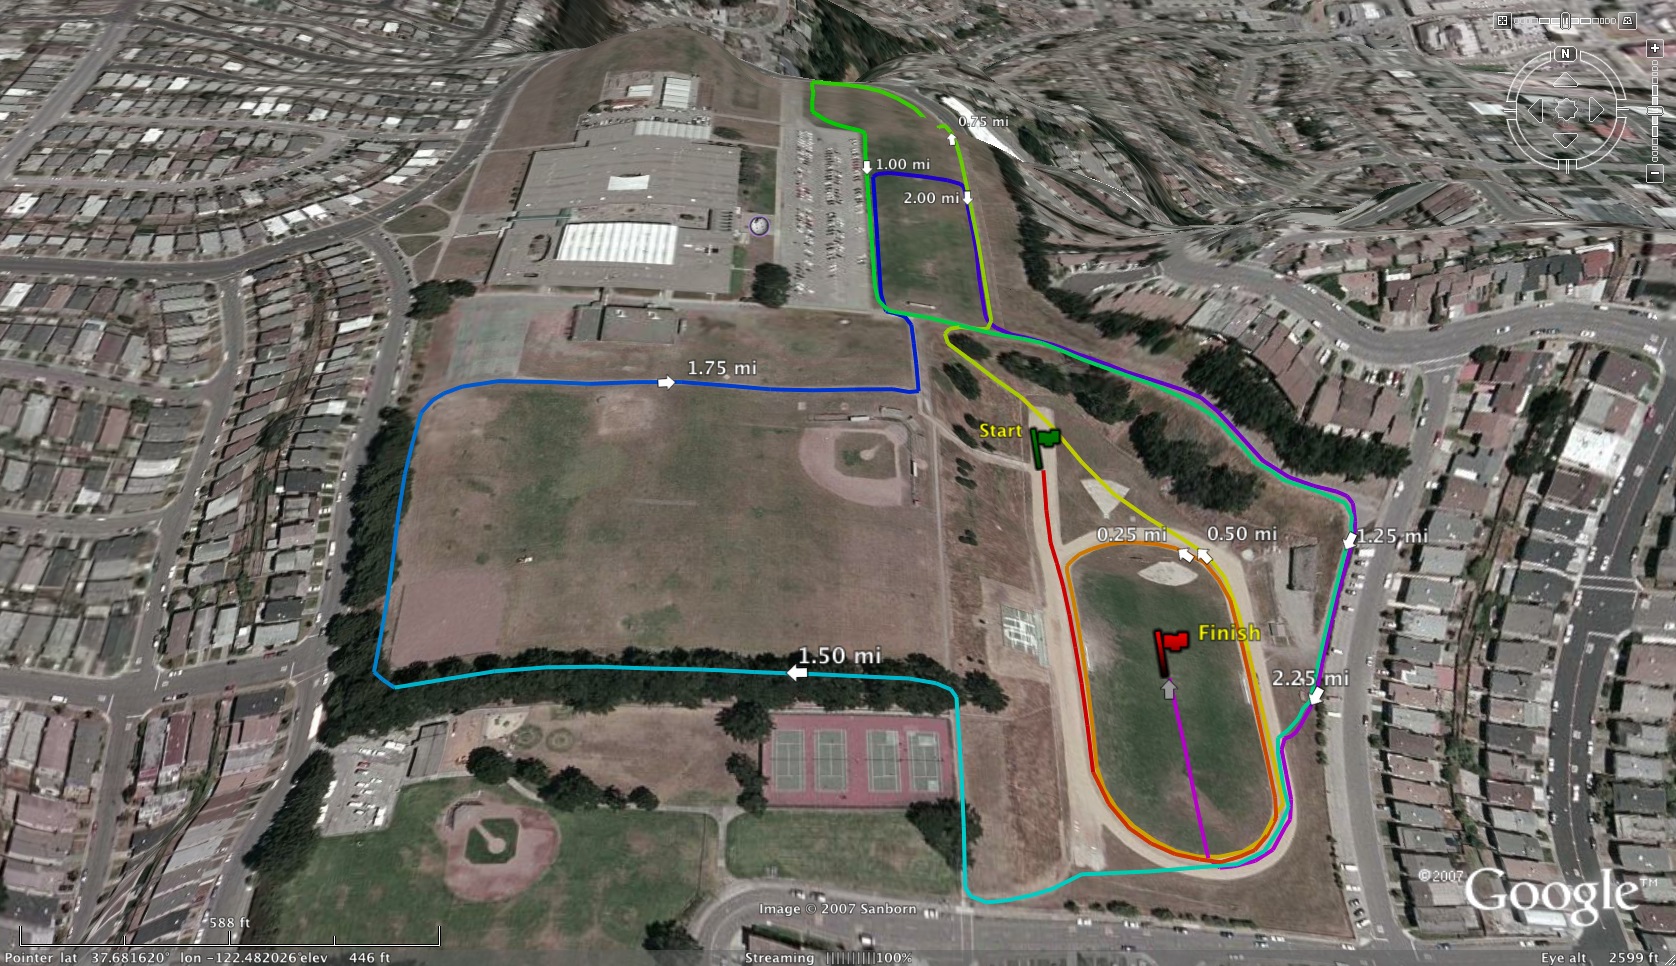
Westmoor HS
Daly City, CA
Gmaps Pedometer
3D image
profile
Google Earth |
6
|
2.367mi |
305.9' |
73.8' |
11.7% |
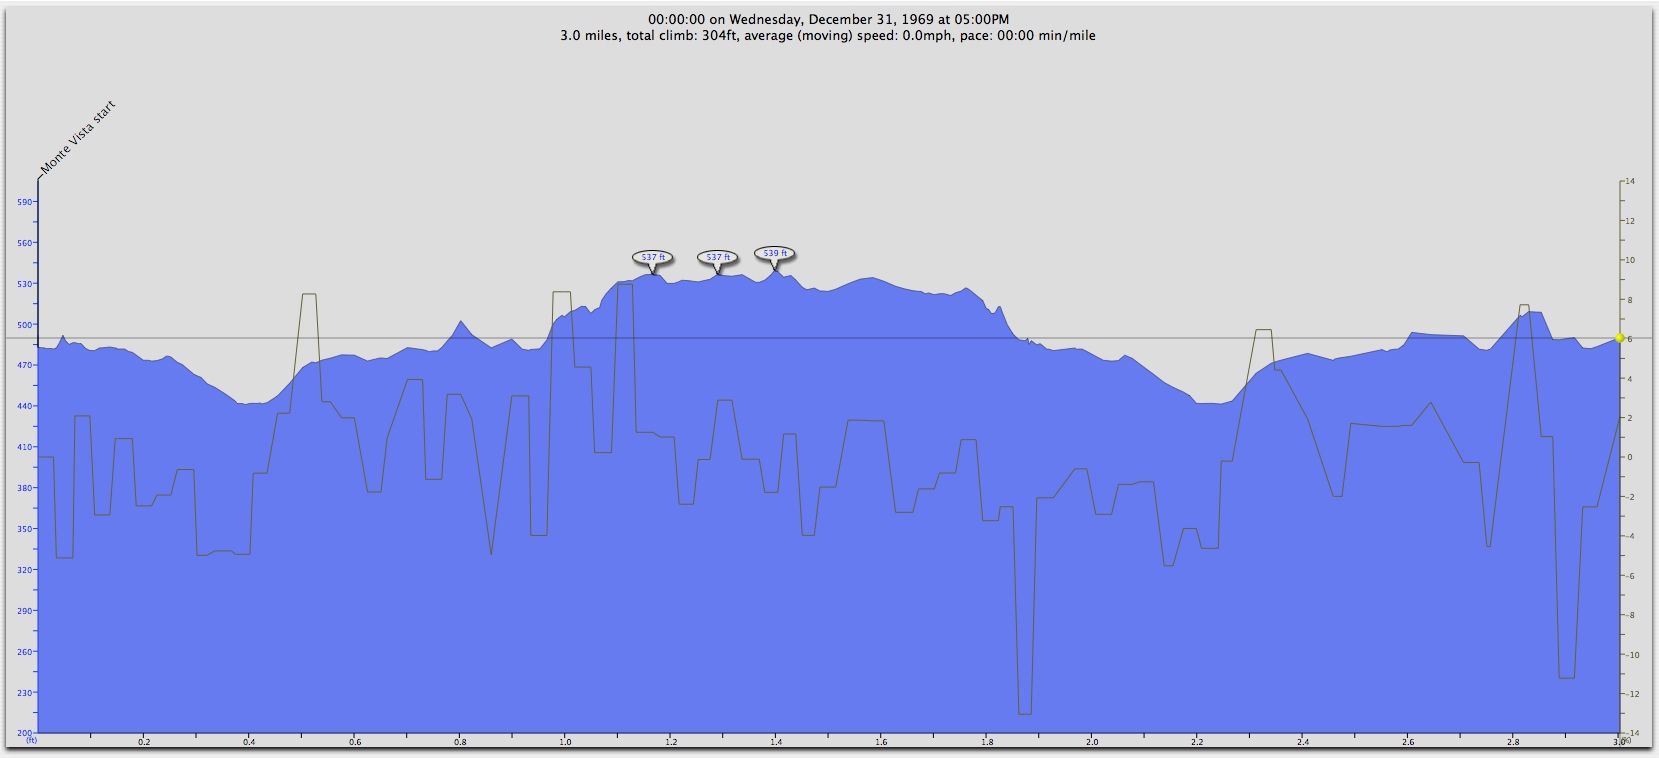
Monte Vista
Danville, CA
Gmaps Pedometer
3D image
profile
Google Earth
|
6
|
3.044mi
|
304.4'
|
98'
|
8.8% |
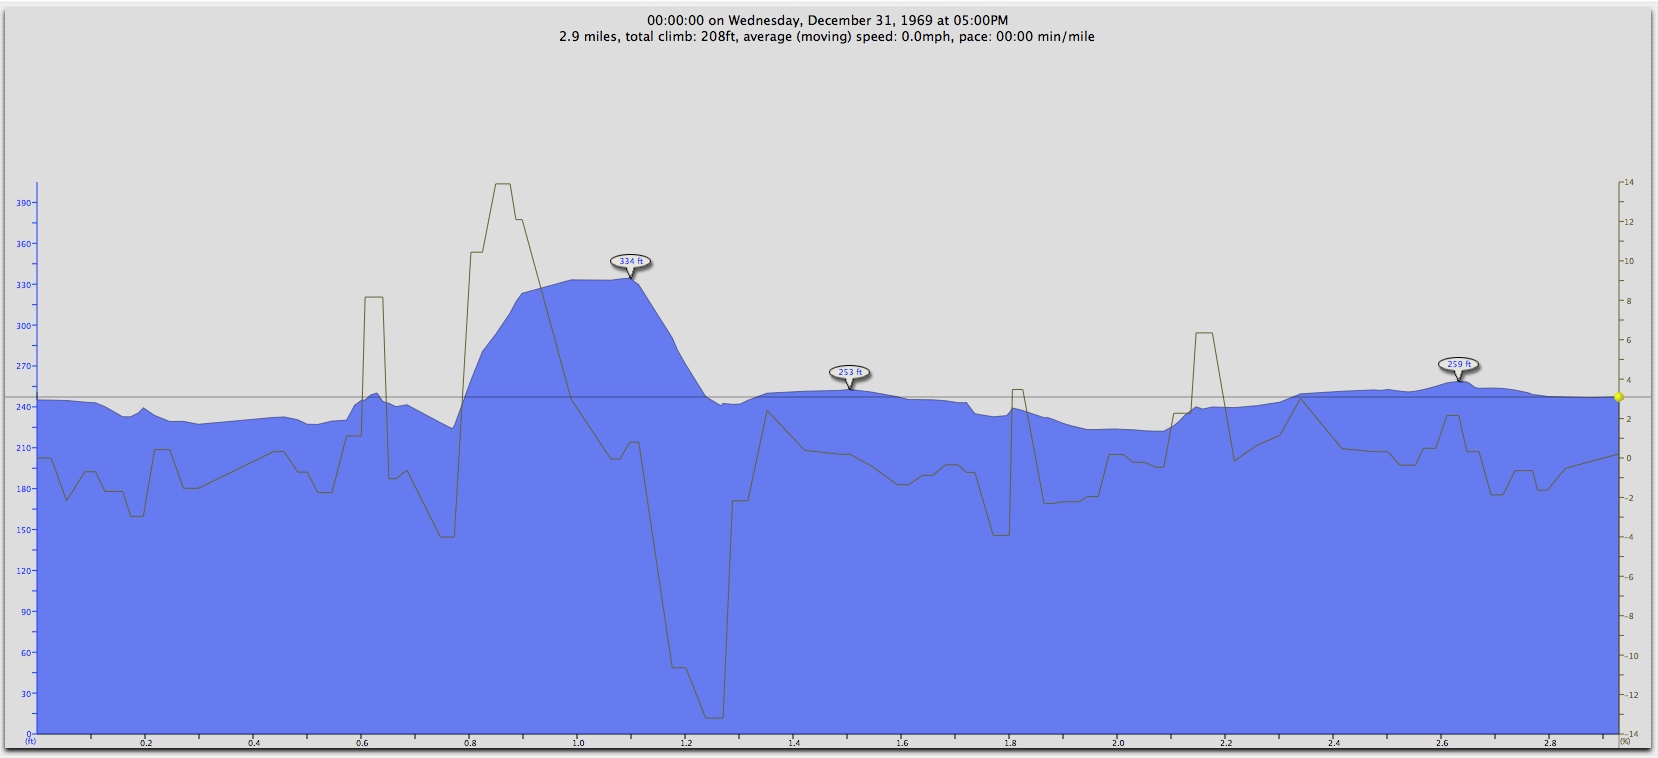
Newhall Park
Concord, CA
Gmaps Pedometer
3D image
profile
Google Earth
|
4
|
3.023mi
|
207.9'
|
111.3'
|
13.9% |
Woodward Park
Fresno, CA
Gmaps Pedometer
3D image
profile
Google Earth
|
5
|
3.101mi |
254.2' |
58.6'
|
10.2% |
Stanford
Palo Alto, CA
Gmaps Pedometer
3D image
profile
Google Earth
|
4
|
3.151mi
|
235.7'
|
63.1'
|
24.9% |
Shadow Cliffs
Pleasanton, CA
Gmaps Pedometer
3D image
profile
Google Earth
|
4
|
2.947mi
|
199.8'
|
81.3'
|
14.2% |
Granite Park
Sacramento, CA
Gmaps Pedometer
3D image
profile
Google Earth
|
4
|
3.19mi
|
196.9' |
59.7'
|
11.3% |